Camystat Software Manual
Dedicated software package for the automated, quantitative analysis of video data from contractile cellular models.
The Camystat application is a dedicated software package designed for the automated, quantitative analysis of video data generated during experiments involving contractile cellular models. Specifically, it processes digital video files (currently the input layer is restricted to the .mov format, although the algorithm itself is agnostic) containing recordings of beating cardiomyocytes (heart muscle cells).
The software's core functionality is to extract and quantify parameters associated with cellular contractility and relaxation events. This facilitates objective, high-throughput characterization required in fields employing iPSC-derived cellular models for functional assessment. Camystat is a multiplatform application and is also available for Linux and macOS. The installation process and usage on these systems are analogous to the Windows version.
Camystat Software Installation
The Camystat software is distributed as a component package that includes an executable file. To launch the program, run the main executable file camystat.exe, which is located in the same folder as the other components. For convenience, a desktop shortcut can be created to facilitate quick access to the software.
Camystat can also be built from source, in which case a typical setup of Visual Studio with support for C++ for classic applications is required, as well as powershell and git.
User Interface of the Camystat Software
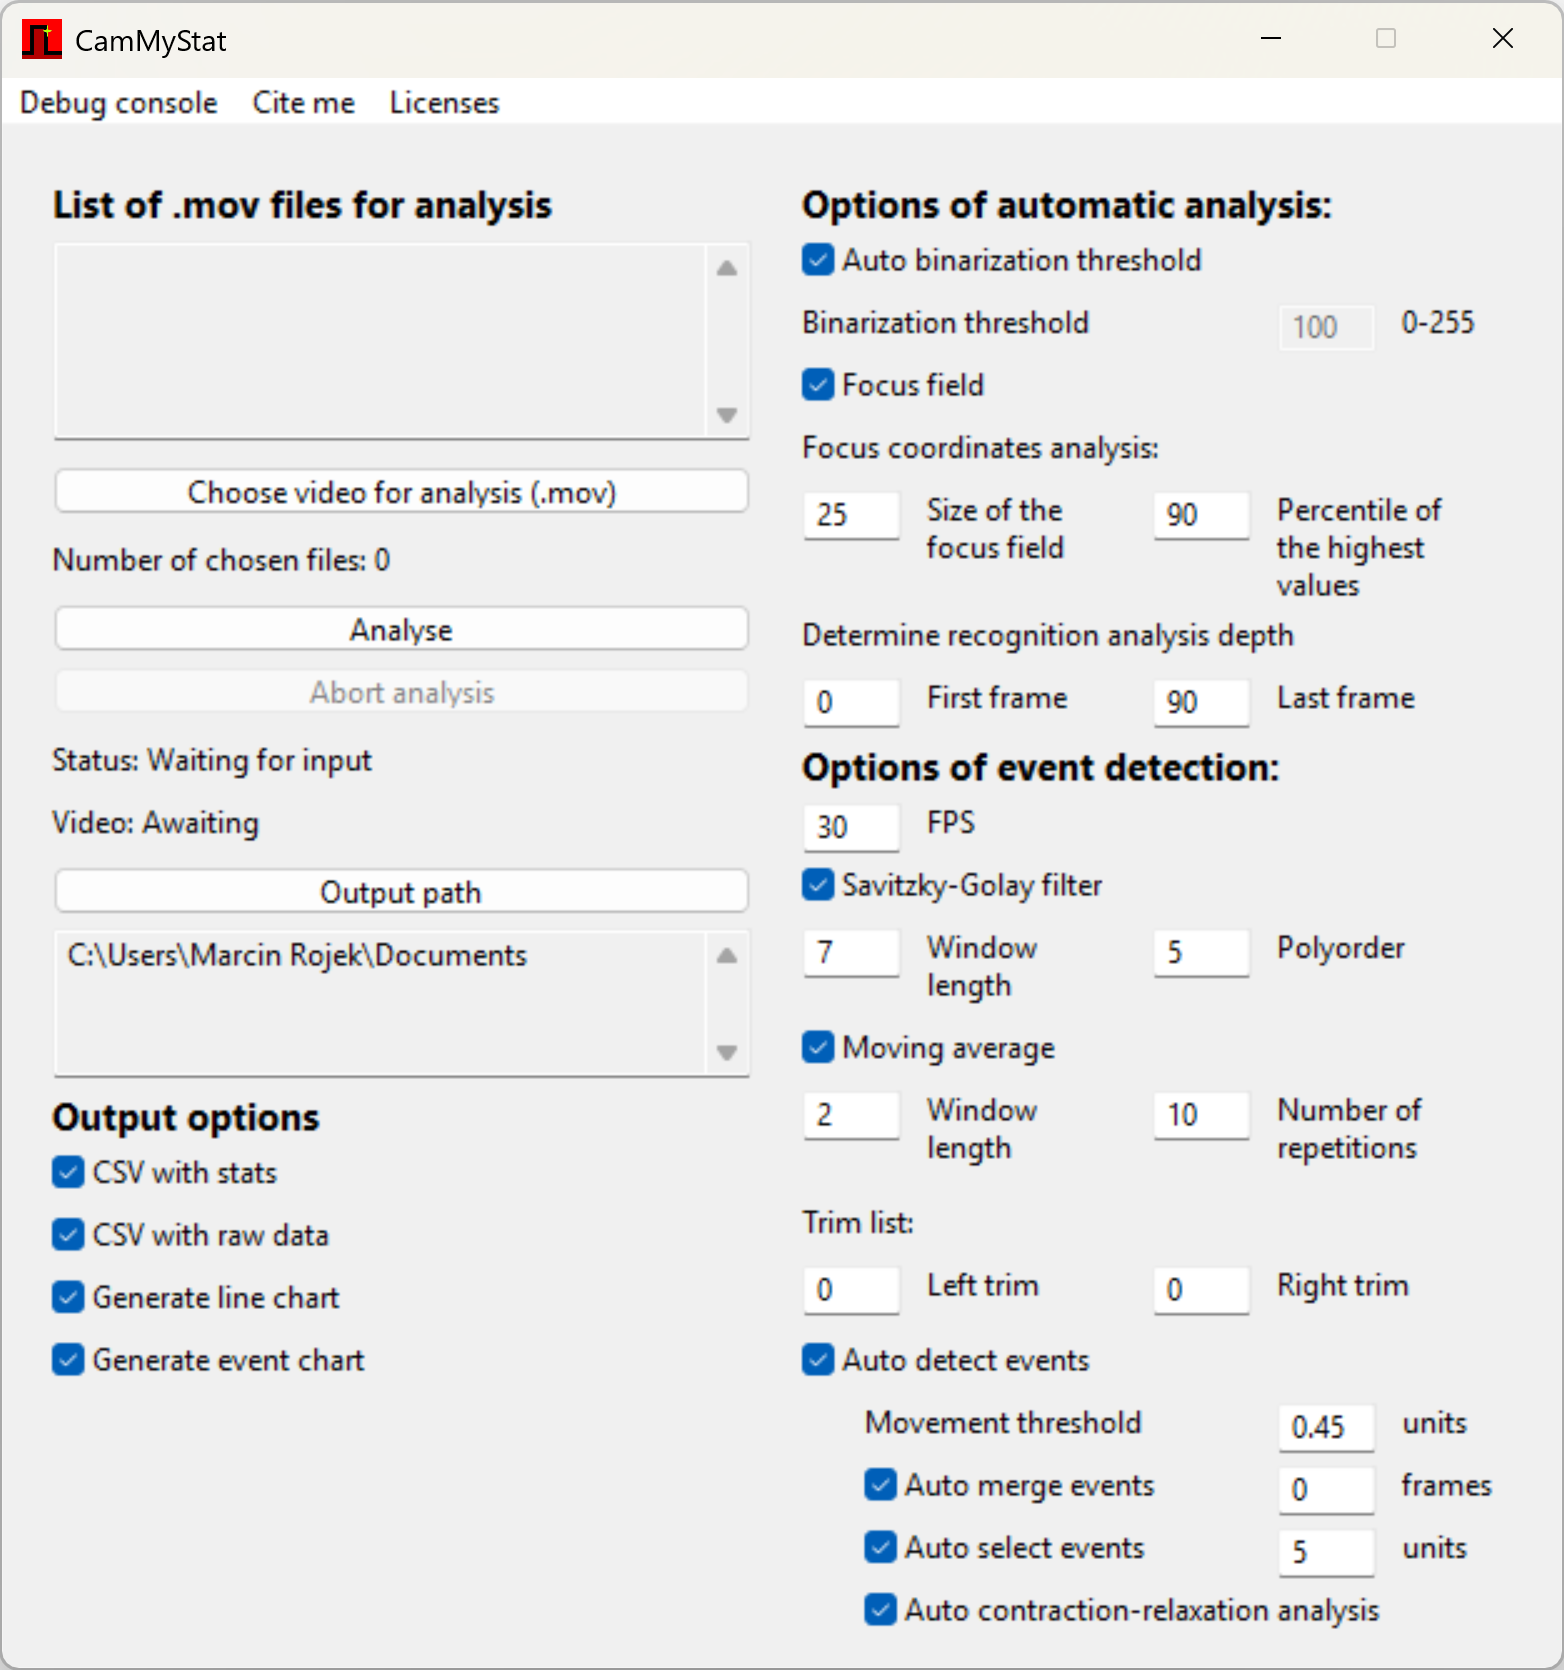
The main window of the Camystat software consists of four primary sections, each corresponding to a different aspect of the program’s operation.
Application menu bar. This section contains items that allow the user to open the Debug Console, display the Cite Me window with author and related publication information, and access the Licenses list for all software dependencies used in the program.
Main control panel (top left). This section provides information on the recordings selected for analysis, buttons to start and prematurely terminate the analysis, a program status display indicating the currently executed operation, and an option to specify the location for the output report (by default, the user’s Documents folder).
Panel of Final report options (bottom left). This section allows the user to select which final report files will be generated (by default, all reports are produced).
- Enabling the “CSV with stats” option generates a summary report file (report.csv) containing statistics such as recording duration, the number and frequency of detected activity cycles, as well as mean durations of activity, rest, contraction, and relaxation phases of the cells.
- Enabling the “CSV with raw data” option generates a CSV file containing unprocessed activity data for each frame of the recording.
- Enabling the “Generate line chart” option produces an interactive time-series plot based on the raw activity data. The chart can be opened directly in a web browser.
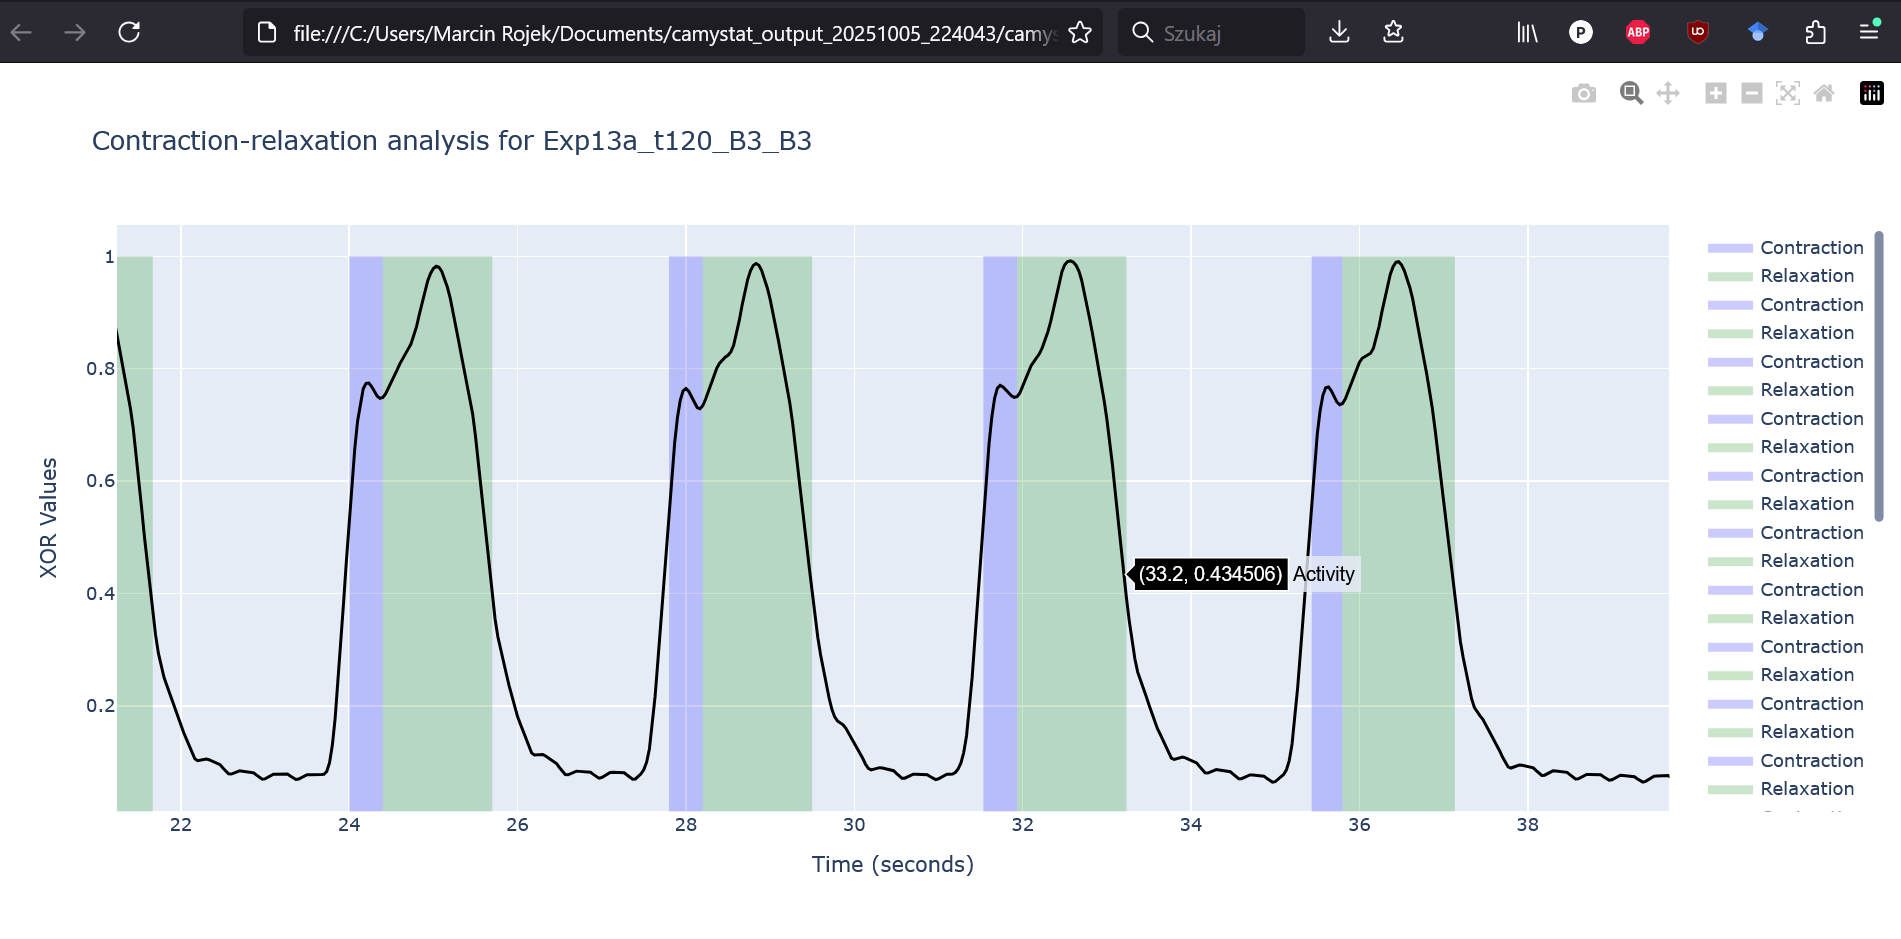
- Enabling the “Generate event chart” option generates an analogous plot based on statistically processed data, with contraction activity events highlighted.
Panel of basic analysis parameters (top right). This section contains parameters used during the preliminary analysis, which aims to determine the optimal settings for the main processing stage of the program.
- Auto binarization threshold (enabled by default); when selected, this option automatically determines the optimal binarization threshold for each recording using the algorithm described in this supplement. Disabling this feature unlocks a field that allows the user to manually define a single threshold value to be applied to all recordings.
-
Focus field (enabled by default); when selected, this option performs a two-stage search for the coordinates with the highest activity, using the algorithm described in this supplement.
- The “Size of the focus field” parameter defines the size of the analyzed area. The area is expressed as a square whose side length corresponds to a given percentage of the recording width (25% by default).
- The “Percentile of the highest values” parameter selects a given percentile (90% by default) of the most active coordinates within the previously defined area.
- Analysis depth (default: 0–90): this parameter specifies the portion of the recording on which the analyses described in points (a) and (b) above are performed.
Panel of event detection options (bottom right). This section contains input parameters for the algorithms responsible for automatic signal smoothing and contraction activity detection.
- Frame rate (FPS) (default: 30) specifies the number of frames per second at which the recording was acquired. This information is subsequently used to compute statistics related to the durations of activity, inactivity, contraction, and relaxation phases of the cells.
-
Savitzky–Golay filter (enabled by default); when selected, this option applies the first-stage smoothing to the activity signal using a polynomial regression filter.
- The “Window length” parameter defines the number of consecutive data points included in each local fitting window (7 by default).
- The “Polynomial order” parameter specifies the degree of the fitted polynomial used for smoothing (5 by default).
- Moving average (enabled by default; parameters: window length = 2, number of repetitions = 10) enables and configures the second smoothing filter applied to the activity signal.
- Trim list (default: left trim = 0, right trim = 0) allows the exclusion of a specified number of frames from the beginning and end of the recording, for example to remove segments related to camera setup or shutdown.
-
Auto detect events (enabled by default); contains parameters for the automatic detection of contraction events:
- Movement threshold (default: 0.45); defines the activity level above which the signal is considered non-random.
- Auto merge events (default: 5 frames); specifies the maximum gap between two consecutive events for them to be treated as a single contraction–relaxation cycle.
- Auto select events (default: 5 units); filters events by size, defined as the area under the activity curve, which reflects both intensity and duration.
- Auto contraction–relaxation analysis (enabled by default) activates automatic analysis of contraction and relaxation events. Enabling this option results in the inclusion of additional statistics in the final report and the generation of an interactive plot illustrating the temporal distribution of contraction and relaxation phases.
Camystat Software Reporting Module
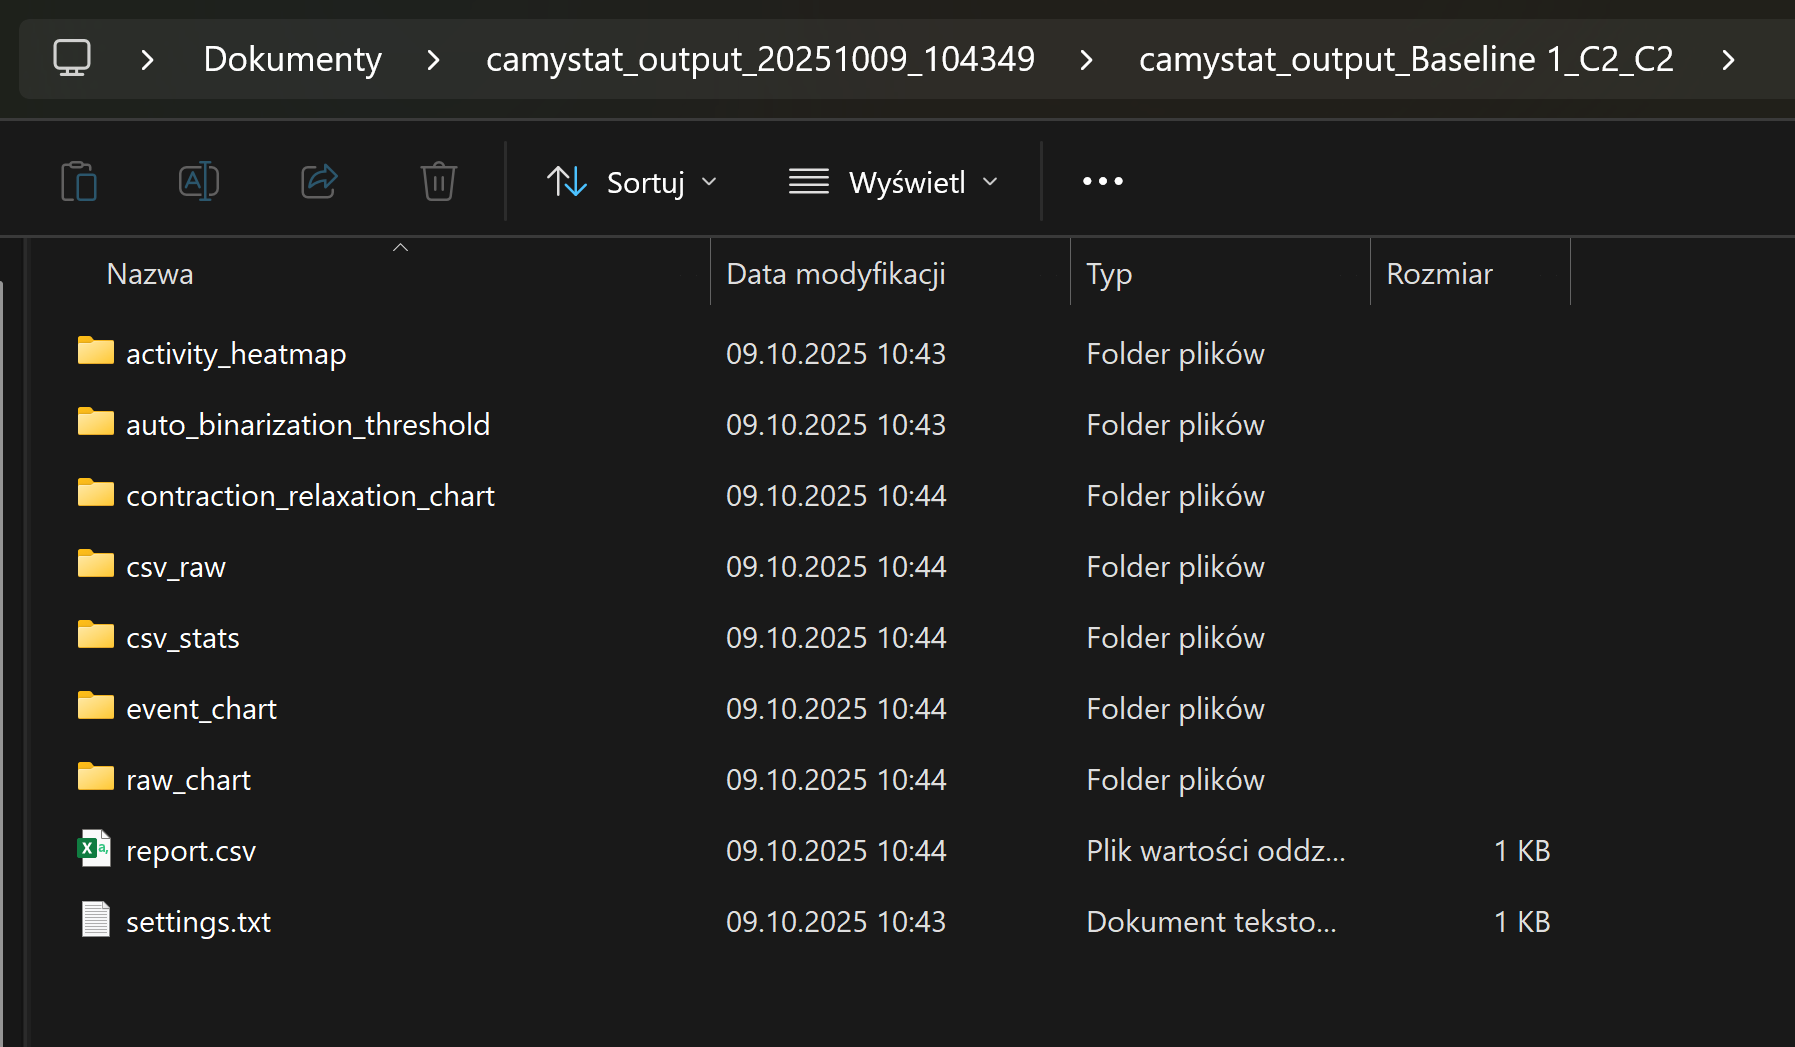
After the analysis is completed, Camystat saves a results folder in the specified location. The folder is named according to the format “camystat_output
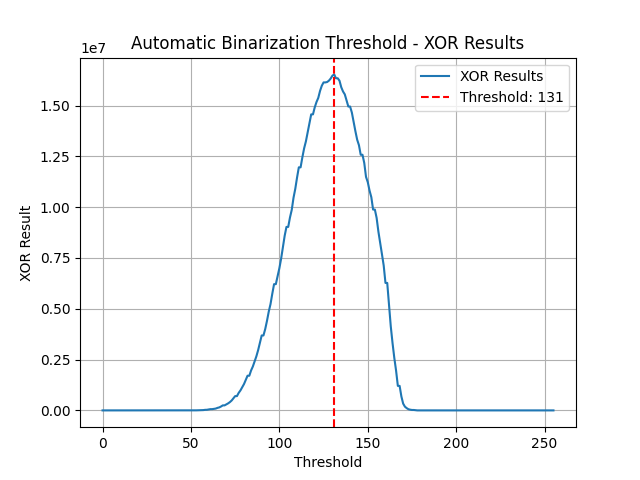
In addition to generating CSV files containing logs and statistical summaries, the Camystat software also provides visualizations of the analysis results. These visualizations include the activity curve with the automatically determined binarization threshold, heatmaps of activity, diagrams indicating the spatial location of the selected coordinates, and interactive Plotly-based time-series charts displaying activity over time together with the detected types of events, exported as HTML files.